Histogram
AviSynth+
Up-to-date documentation: https://avisynthplus.readthedocs.io
A multipurpose audio/video analysis tool.
Contents |
Syntax and Parameters
Histogram(clip clip [, string mode, float factor])
Histogram(clip clip [, string mode, float factor, int bits, bool keepsource, bool markers]) AVS+
- clip clip =
- Source clip.
- AVS+ Deep Color (bit depth greater than 8) supported in Classic, Levels and Color modes only.
- string mode = "classic"
- Classic (waveform) mode, the default;
- Levels YUV histogram mode AVS+ also RGB and Y
- Color and Color2 vectorscope modes;
- Luma special viewing mode;
- Audiolevels audio level meter; and
- Stereo, StereoOverlay, and StereoY8 audio graphs.
- float factor = 100.0
- Vertical scale is multiplied by 100.0 / factor. Applies only to Levels mode.
- NOTE, factor is an unnamed optional argument;
Histogram(mode="levels", factor=0.5)will not work, butHistogram("levels", 0.5)works fine.
- int bits = 8
- AVS+ Accepts 8, 9, 10, 11 or 12 as input. Applies only to Classic, Levels and Color modes.
- Classic, Levels: increases the width of the histogram by 2(bits-8)
- Color: increases width and height of the histogram by 2(bits-8)
- For example,
Histogram(bits=10)returns a 1024 pixel wide histogram (width is 256 by default)
- AVS+ Accepts 8, 9, 10, 11 or 12 as input. Applies only to Classic, Levels and Color modes.
- bool keepsource = true
- AVS+ if true (the default), add histogram to right side of existing clip; else return the histogram portion only.
- bool markers = true
- AVS+ if true (the default), show calibration marks (see screenshots); else hide them.
The modes are summarized as follows:
Mode Width Height Formats factor bits keepsource markers Classic 256* (Source) YUV(A), Y 8, 9, 10, 11, 12 Y Y Levels 256* 256 YUV(A), Y, RGB(A) Y 8, 9, 10, 11, 12 Y Y Color 256* 256* YUV(A) 8, 9, 10, 11, 12 Y Color2 256 256 YUV(A) Y Luma (Source) (Source) 8bit YUV AudioLevels (Source) (Source) 8bit YUV Stereo 512 512 8bit YUV StereoY8 512 512 8bit YUV, Y StereoOverlay (Source) (Source) 8bit YUV *size = 256 (bits=8, default), 512 (bits=9), 1024 (bits=10), 2048 (bits=11), 4096 (bits=12)
"Levels" mode supports Y from Avisynth+ 3.6.1
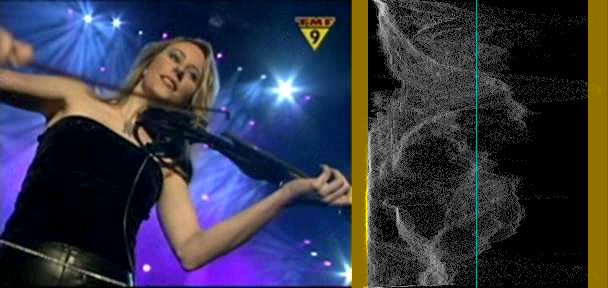
Classic mode
Histogram
Available in YUV color formats only. For RGB sources, try HistogramRGBParade.
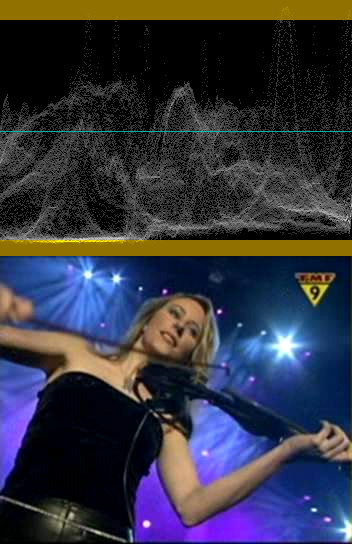
This will add a per-line luminance graph (usually called a Waveform Monitor) on the right side of the video, increasing clip.Width by 256. The left side of the graph represents luma=0 and the right side represents luma=255. Values outside the valid CCIR-601 range are shown with a brown/yellowish color background; a greenish line represents Y=128.
If you prefer to see luma=0 on bottom and luma=255 on top, use this:
Levels mode
Histogram("levels")
Available in all YUV planar color formats, except Y8. For RGB sources, try HistogramRGBLevels.
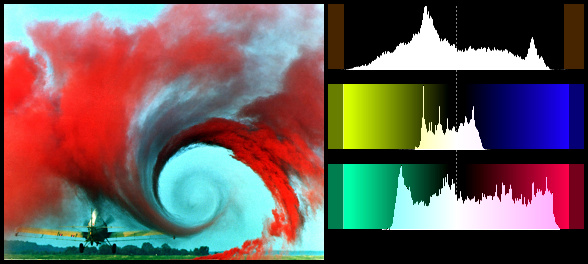
This mode will display three histograms on the right side of the video frame, increasing clip.Width by 256. This will show the distribution of the Y, U and V components in the current frame.
The top graph displays the Y (luma) distribution of the frame, where the left side represents Y=0 and the right side represents Y=255. Values outside the valid CCIR601 range have been indicated with faded colors; Y=128 has been marked with a dotted line. The vertical axis shows the number of pixels for a given luma (Y) value.
The middle graph is similar, and displays the U component; the bottom graph displays the V component.
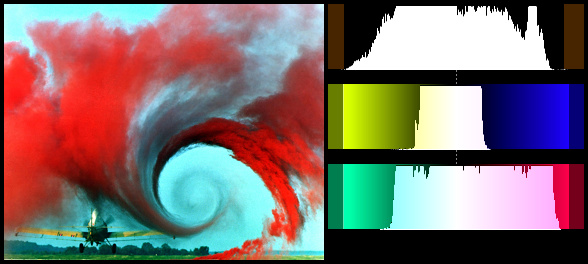
The factor option (100.0 by default) specifies how the histograms are displayed, exaggerating the vertical scale. It is specified as percentage of the total population (that is number of luma or chroma pixels in a frame). For example:
Histogram("levels", 0.5)
NOTE, factor is an unnamed optional argument;
Histogram(mode="levels", factor=0.5) will not work, but Histogram("levels", 0.5) works fine.
Color mode
Histogram("color")
Available in all YUV planar color formats, except Y8.
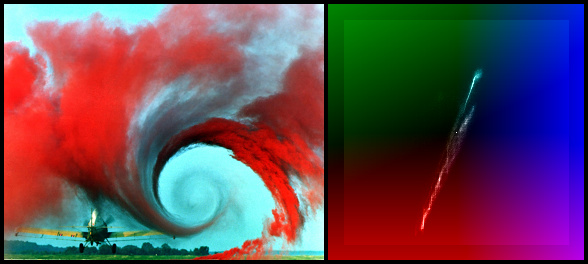
This mode will display the chroma values (U/V color placement) in a two dimensional graph (called a vectorscope) on the right side of the video frame, increasing clip.Width by 256. It can be used to read of the hue and saturation of a clip. At the same time it is a histogram: the whiter a pixel in the vectorscope, the more pixels of the input clip correspond to that chroma value. The lighter background denotes the valid CCIR-601 range.
|
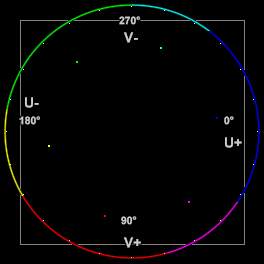
Labels have been added to this vectorscope image for explication purposes, showing the U and V axes and degrees of hue. Spots have also been added, showing 75% saturated ColorBars (clockwise from 0°: blue, magenta, red, yellow, green and cyan). The U component is displayed on the horizontal (X) axis, with U=0 on the left and U=255 on the right. The V component is displayed on the vertical (Y) axis, with V=0 on the top and V=255 on the bottom. The position of a spot on the scope corresponds to a chroma value from the input clip. The graph can be used to read hue and saturation. As the hue of a color changes, the spot moves around the center. As the saturation changes, it moves in or out from the center. The center is where U and V equal 128, the saturation is zero and the corresponding pixel has no color. As you increase the saturation, the spot moves towards the edge. |
At U=255, V=128 the hue is zero (blue) and the saturation is at maximum, that is,
- saturation = sqrt( (U-128)2 + (V-128)2 ) or 127
- saturation = sqrt( (U-128)2 + (V-128)2 ) or 127
When turning hue clockwise 90 degrees, the chroma is given by U=128, V=255 (red, approximately). Keeping the hue constant and decreasing the saturation, means that we move from the circle to the center of the vectorscope. Thus the color flavor remains the same, only it fades slowly to greyscale.
Color2 mode
Histogram("color2")
Available in all YUV planar color formats, except Y8.
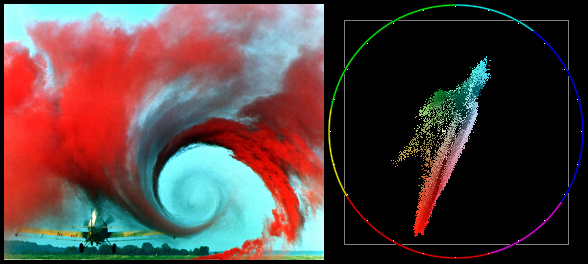
This mode will display the pixels in a two dimensional graph (called a vectorscope) on the right side of the video frame, increasing clip.Width by 256. It can be used to read of the hue and saturation of a clip.
The U component is displayed on the horizontal (X) axis, with the leftmost side being U=0 and the rightmost side being U=255. The V component is displayed on the vertical (Y) axis, with the top representing V=0 and the bottom representing V=255. The white square denotes the valid CCIR-601 range.
| As above, labels and ColorBars dots have been added to this vectorscope image for explication purposes.
The position of a spot on the scope corresponds to a chroma value from the input clip, exactly as with Color2 mode is also different from Color mode in that the background is black instead of shaded, and a color wheel around the circumference of the scope has been added, divided into six hues (clockwise from 0°: blue, magenta, red, yellow, green and cyan), with white tick marks at 15 degree intervals. |
Luma mode
Histogram("luma")
Available in YUV planar and YUY2 color formats.
This mode will amplify luminance, and display very small luminance variations. This is good for detecting blocking and noise, and can be helpful at adjusting filter parameters. In this mode a 1 pixel luminance difference will show as a 16 pixel luminance pixel, thus seriously enhancing small flaws.
Audiolevels mode
Histogram("audiolevels")
YUV planar video is required. Audio is converted to 16 bit.
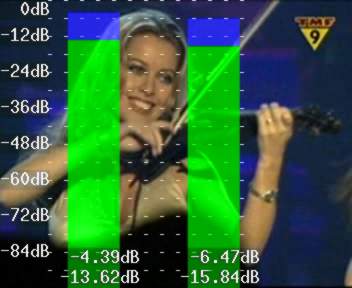
Shows the audio levels in decibels for each channel present. For example, if the source has six channels of audio, six vertical bars will be shown.
- The green bars show the RMS (Root Mean Square) level of the audio in each video frame (let's say n samples) using the following formula:
- The blue bars show the max (peak) level of the audio in each video frame using the following formula:
The maximum possible level without clipping is 0 dB by definition. The minimum level for 16 bit audio is therefore
Stereo, StereoY8 and StereoOverlay mode
Histogram("stereo")
Requires a source clip with stereo audio; StereoOverlay also requires a source clip with a YUV planar color format.
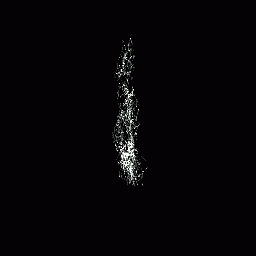
These modes show a classic stereo graph (or Lissajous pattern) from the clip audio, often seen in recording studios. They are used to view the left-right phase distribution of the input signal. In-phase stereo appears predominantly vertical (as shown), but incorrectly phased stereo appears predominantly horizontal. Two-channel Mono appears as a vertical line.
StereoOverlay will overlay the graph on top of the original. Each frame will contain only information from the current frame to the beginning of the next frame. The signal is linearly upsampled 8x, to provide clearer visuals. Stereo and StereoY8 won't overlay the graph on the video, but will just return the graph alone as a 512×512 video clip (in YV12 or Y8 format respectively).
Changes
| v2.60 | Added StereoY8 mode. Added factor option. |
| v2.58 | Added planar support. Color2 and Audiolevels modes added. |
| v2.56 | Added invalid colors in YUY2 mode. |
| v2.56 | Added dots to mode = "stereo" to show bias/offsets. |
| v2.53 | Added different modes. |
