This plugin function filters the image row by row. Filters can be either Gaussian, or Butterworth or custom designed in frequency domain. Noise that appears vertically or sub vertically aligned (noise really is row wise) is filtered.
Standard filters included are low cut (high pass), highcut (low pass), band stop and notch reject filters either Gaussian or Butterworth. These standard filters can be cascaded. Filter can be custom (user) designed. Cascading custom designed filters with standard filters is not allowed. The custom designed filter is smoothed (degree times). This plugin compliments the time domain VFan Function of FanFilter plugin.
Standard filters are specified using two letter names as below:
First letter be either b for butterworth, or g for gaussian.
Second letter be either h (high cut) or l (low cut), or b (band stop)
or n( notch reject).
The first value after filter name is the frequency , 50% or 67% amplitude cut off
(for gl gh and bl, bh filters), or center
frequency of notch or bandstop (for gn,bn, gb, bb filters).
The second value is %age of center freq value to be used
as notch width or bandwidth and must be specified even if not relevant.
In case of Butterworth filters 'degree' value is used to design the degree or sharpness of filter. The higher the degree the sharper will be the filter, but produces more ringing. Degree of 1 is equivalent to Gaussian filters which are gentler and do not produce ringing. Only one value of degree is used for all the butterworth filters in the cascade.
Custom filter is specified by the first entry being "custom". A sereis of frequency and amplitude pairs are to be given. the first amplitude value is back ward propogated upto zero freq, and the last pair amplitude is propogated up to the nyquist frequency. The frequency values must increase monotonically. The custom filter is smoothed with 3 point average 'degree' times.
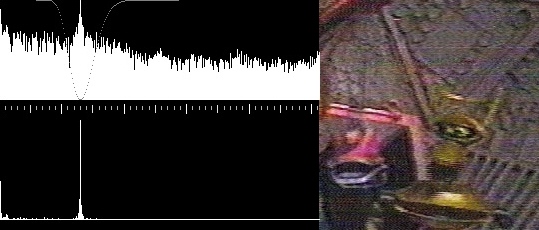
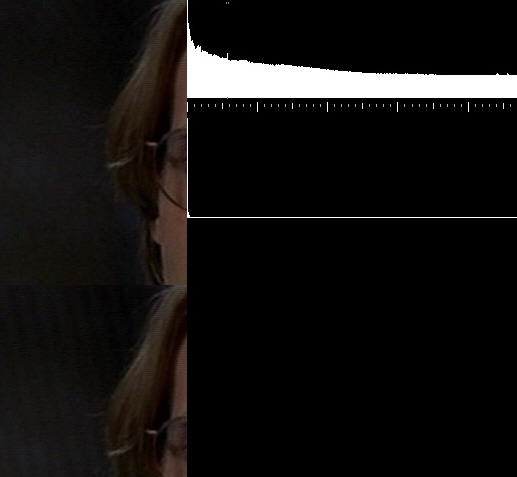
A test facility is included. In this option, in one half of frame, the power spectrum of specified row(s) is shown in two panels one with gamma scale and filter profile, and other unscaled. In the other half of frame top quarter the image filtered with specified filter is displayed. In the lower quarter the unfiltered image is displayed. Atleast one filter set, even a dummy need to be specified. The horizontal ruler graduations (100s, 50s and 10s) assist in specifying frequency values.
The spectral display will be averaged spectrum of starting row to end row. This smmothes out a lot of noise and brings out persistant frequencies.
Presence of sharp high amplitude objects (such as logos) can create severe ringing due to filtering. A sharp discontinuity requires all frequencies of spectrum to be present. Any filtering that affects the balance can create undesirable ringing. If possible cropping and re joining after processing may be useful in those cases.
With the option 'morph' set to true, homomorphic filtering is done
Only YUY2 and YV12 formats are acceptable. Y values only are processed.
| Description | Name | Type | Limits | Default |
| Input clip | clip | none | ||
| Array of values | sets of string and integers. If first entry is "custom" then pairs of frequency and percentage amplitude must follow. If first entry is any standard filter abbrevation specified, then each filter name to be followed by a frequency and bandwidth % age value pair. (Bandwidth is not used for low cut and high cut.but a value must be specified. The acceptable filter names are : bl, bh, bb, bn, gl, gh, gb, gn. | none | ||
| Degree of Butterworth or smoothing of custom filter | degree | integer | 0 for custom and 1 for butterworth to 32 | 2 |
| Is this a test run? | test | boolean | >true for yes | false |
| Starting Row number of frame to use for test | row | integer | within frame height | middle row |
| Ending Row number of frame to use for test | erow | integer | not less than 'row' and within frame height | row |
| gamma value to be used for scaling | gamma | float | 1.0 is no scaling | 0.1 |
| whether homomorphic filtering is to be done? | morph | boolean | true or false | false |
| whether spectral display to be in left half of frame? | left | boolean | true or false for right half display | true |

